Goal. In this beginner guide you will draw one reproducible random graph, turn it into a six-qubit graph state, verify its stabilizers, rotate the measurement basis, and collect samples with Qiskit. Everything runs locally on a state-vector simulator; no IBM Quantum account is required.
The example is deliberately small enough to inspect by hand. It teaches the logical pipeline used by the larger project, but it is not the released 70-qubit circuit and not a miniature proof of quantum advantage.
Step 1 — What is a graph?
A graph consists of vertices and edges. We write it as G = (V,E). In the toy model, each vertex becomes one qubit and each edge becomes one controlled-Z gate.
We use six labelled vertices:
\[V=\{0,1,2,3,4,5\}.\]Six vertices give 15 possible undirected edges because
\[\binom{6}{2}=15.\]Step 2 — Why is the graph random?
We draw an Erdős–Rényi graph G(n,p). Every possible edge is considered once and accepted independently with probability p. For this example, n = 6 and p = 0.40.
The word random has three different roles here:
- Random instance: the program uses random numbers to decide which edges belong to the graph.
- Fixed experiment: a seed freezes that draw. Seed 23 always gives the same six edges, so another reader can reproduce the circuit exactly.
- Quantum samples: after the circuit is fixed, measurement returns random bit strings according to the Born probabilities of that fixed state.
The graph is therefore not redrawn for every shot. First we select one instance; then we sample that instance many times. Changing the graph seed asks a different scientific question from changing the shot seed.
Random graph families are useful because they let researchers study typical instances instead of a hand-picked lattice with unusually convenient structure. Their connectivity can distribute entanglement across many cuts and remove symmetries that a classical algorithm might exploit. Randomness alone, however, does not guarantee classical hardness or quantum advantage.
Our seeded toy graph
The edge list is
\[E=\{(0,4),(1,4),(1,5),(2,4),(3,4),(3,5)\}.\]You can check the same object as an adjacency list:
0: 4
1: 4, 5
2: 4
3: 4, 5
4: 0, 1, 2, 3
5: 1, 3
Step 3 — Turn the graph into a quantum state
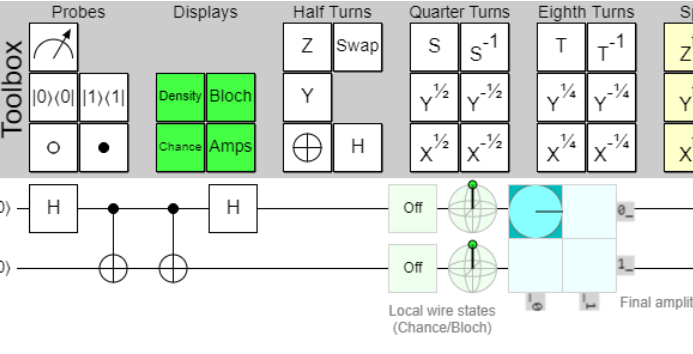
Start every qubit in |0⟩ and apply a Hadamard gate. This produces |+⟩ on every vertex. Then apply one CZ gate for every edge:
\[|G\rangle=\prod_{(i,j)\in E}CZ_{ij}\,|+\rangle^{\otimes 6}.\]The graph is now encoded in phases of the six-qubit wavefunction. Every computational-basis amplitude still has the same magnitude, but CZ gates add minus signs determined by the selected edges.
Step 4 — Verify the graph state by hand
Every vertex v has a stabilizer generator
\[K_v=X_v\prod_{u\in N(v)}Z_u.\]For vertex 0, the only neighbour is vertex 4, so K0 = X0Z4. For the central vertex 4, the neighbours are 0, 1, 2 and 3, so K4 = X4Z0Z1Z2Z3.
The ideal graph state satisfies
\[\langle G|K_v|G\rangle=1\qquad\text{for all six vertices}.\]The companion script evaluates all six expectations and the tests require every value to equal one within numerical precision. This is a much stronger construction check than merely seeing that the circuit runs.
Step 5 — Why rotate before measuring?
If we measure an ideal graph state directly in the computational Z basis, every bit string has equal probability. The graph changes phases, not amplitude magnitudes, so a plain Z-basis histogram hides the edge structure.
The toy circuit therefore applies the same local face-state basis pattern used by the released benchmark circuit:
\[T^\dagger H\,R_z(\theta)\,H,\qquad \theta=\arccos(1/\sqrt{3}).\]The non-Clifford angle converts the hidden phase pattern into different output probabilities. The resulting histogram is no longer uniform. This is where graph connectivity and the measurement basis meet to create the sampling problem.
Step 6 — Run the complete Qiskit example
Install the Qiskit version pinned by the project and run the following code:
python -m pip install qiskit==2.4.1import math
import random
from qiskit import QuantumCircuit
from qiskit.primitives import StatevectorSampler
N = 6
P = 0.40
GRAPH_SEED = 23
SHOT_SEED = 2026
SHOTS = 2048
# Draw one reproducible G(n,p) graph.
rng = random.Random(GRAPH_SEED)
edges = [
(i, j)
for i in range(N)
for j in range(i + 1, N)
if rng.random() < P
]
# Vertices become |+> qubits; edges become CZ gates.
qc = QuantumCircuit(N)
qc.h(range(N))
for i, j in edges:
qc.cz(i, j)
# Rotate into the benchmark-style face-state basis.
theta = math.acos(1 / math.sqrt(3))
for q in range(N):
qc.tdg(q)
qc.h(q)
qc.rz(theta, q)
qc.h(q)
qc.measure_all()
# Ideal local sampling: no cloud account or QPU required.
sampler = StatevectorSampler(default_shots=SHOTS, seed=SHOT_SEED)
result = sampler.run([qc]).result()[0]
counts = result.data.meas.get_counts()
print("edges =", edges)
print("shots =", sum(counts.values()))
print("unique bit strings =", len(counts))
print("top =", sorted(
counts.items(),
key=lambda item: (-item[1], item[0]),
)[:10])For the declared seeds, the tested run prints the six edges shown above, 2,048 total shots and all 64 possible bit strings. The most common strings occur much more often than the uniform expectation of 32 counts per string. Qiskit displays bit strings with the highest-index classical bit on the left.
Three experiments to try
- Change only
SHOT_SEED. Individual counts change, but the graph and underlying probability distribution stay fixed. - Change only
GRAPH_SEED. The edge list, CZ circuit and output distribution all change. - Remove the face-basis rotation. The ideal Z-basis probabilities become uniform, illustrating why graph phases need a suitable measurement basis.
You can also vary p. At p = 0 there are no CZ gates and no graph entanglement. At p = 1 the graph is complete but highly structured. Intermediate random instances are neither automatically hard nor automatically easy; their properties must be analysed.
How this toy relates to the 70-qubit project
The conceptual chain is the same:
graph → qubits → entangling gates → local basis rotations → bit-string samples → verification.
The released benchmark is nevertheless much more demanding. It fixes a specific 70-data-qubit, depth-70 hardware-aware construction, contains thousands of CZ operations, and adds spacetime checks plus direct fidelity estimation. This six-qubit graph has none of those scale, noise or postselection challenges. Its purpose is understanding and code validation.
Sources and next step
- NetworkX documentation for the G(n,p) random-graph model
- IBM Quantum documentation for StatevectorSampler
- Ghosh, Hangleiter and Helsen: Random Regular Graph States Are Complex at Almost Any Depth
- Quantum Advantage Tracker issue 151: the released 70-qubit instance
- Complete Random Graph project repository
Continue with part 1 for the graph-state theory behind the construction, then part 2 for the hardware-compatible circuit.